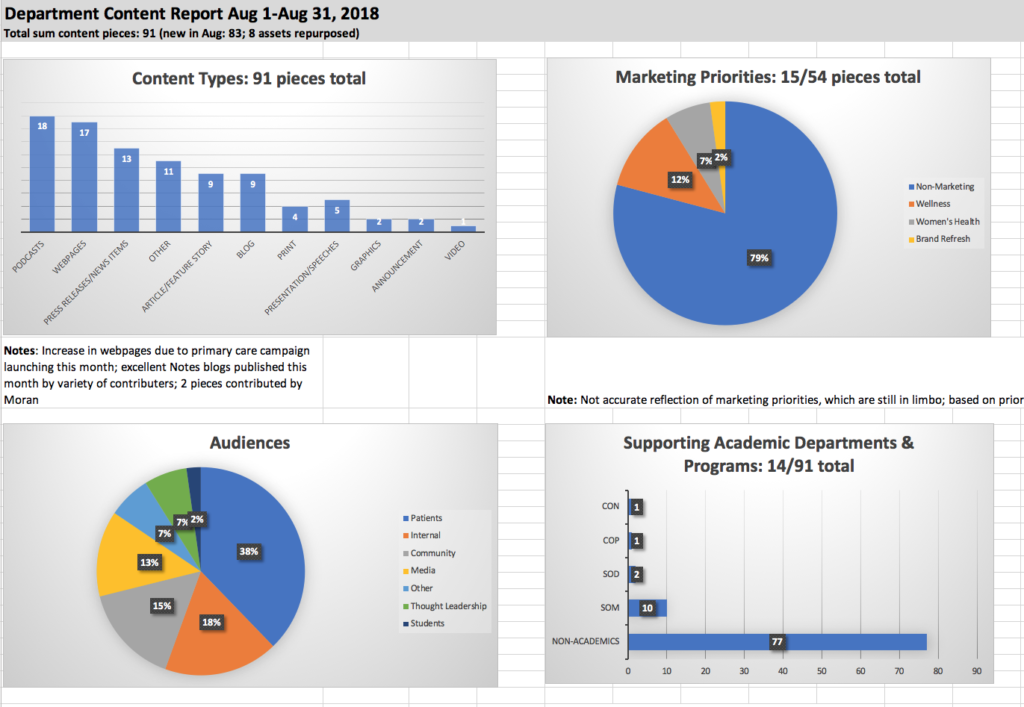
Fig 4: Charts and graphs created in Excel showing the content lists sorted by different categories; 15 content pieces aligned with clinical marketing priorities and 14 with academic. Btw, 91 total assets was like a freaking miracle for us at U of U Health. I think we broke the bank on that one.